Abstract
Routine inspection and maintenance of concrete infrastructure must be performed to ensure structural integrity and prevent structural failures which may cause damage to surrounding infrastructure, environmental pollution and potential loss-of-life. Typically, regular visual inspection is conducted to identify various defects due to environmental exposure during the service life of the structure (such as cracks, loss of material, rusting of metal bindings, etc). Visual inspection can provide a wealth of information that may lead to positive identification of the cause of observed distress. However, its effectiveness depends on the knowledge and experience of the investigator and is prone to human error. Additionally inspection of large structures such as dams, bridges and tall buildings can be prohibitively risky and difficult due to hard-to-reach facets. Through this paper we illustrate the use of Artificial Intelligence (AI) techniques to automate the inspection process and for identification of defects (surface cracks) efficiently. The surface crack detection solution described below is designed for deployment on embedded platforms such as UAVs or sub-surface rovers and uses deep learning algorithms to detect and classify structural cracks on concrete surfaces (like pavement, walls and bridges).
Introduction
An alternative approach to manual inspection is an automatic crack detection system that works by leveraging methods from computer vision (e.g., gradient thresholding and edge detection).This can lead to automated inspection systems which cater to a select set of surface types and features. Here, we explore the potential of a deep learning-based crack detection system that can be used on multiple surface and crack types.
Convolutional Neural Networks (CNNs)5 are a class of deep-learning neural networks6 that are frequently used in image classification and segmentation (pixel-wise classification) tasks. They are known for adaptability, particularly in cases where the neural network topology has many layers, which has been shown to allow them to learn low-level features t(e.g., lines, edges and angles), and high-level features (e.g., curved surfaces and textures). Our approach to automatic crack detection leverages a topology belonging to this class—Faster R-CNN3 with ResNet-101 as a backend feature extractor, enabling it to detect and draw a bounding box around any crack identified in an image.
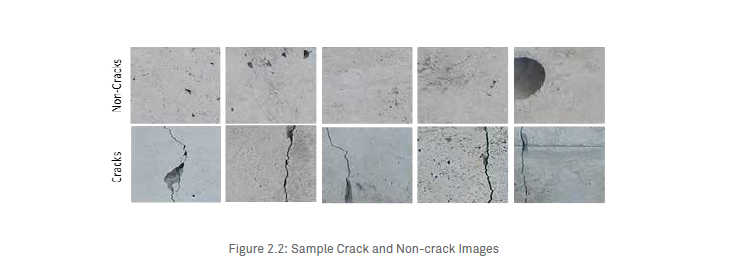
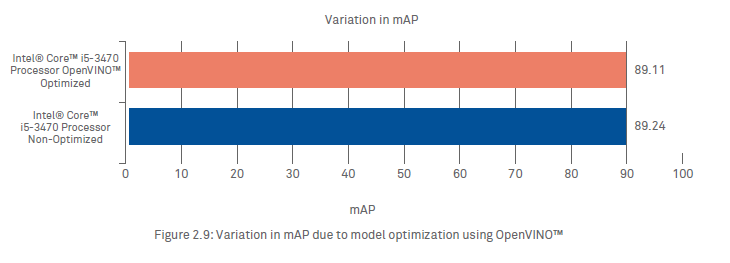
To train our model, we randomly partitioned the SDNET20182 (refer figure 2.2 below) dataset into 70% for training and 30% for evaluation. To compensate for the limited size of available dataset, a Faster R-CNN3 Resnet-101 model (pre-trained on a coco dataset4 - a large-scale object detection, segmentation, and captioning dataset) has been re-trained on all layers with our training dataset. Model hyper-parameters were fine-tuned to improve the mean average precision (mAP), achieving 89.11% after 15,000 iterations.
The Intel® Distribution of OpenVINOTM1 toolkit1 has been used to optimize the inference time of our model on Intel® architectures
Surface Crack Detection Process
Our approach to surface crack detection has five stages:
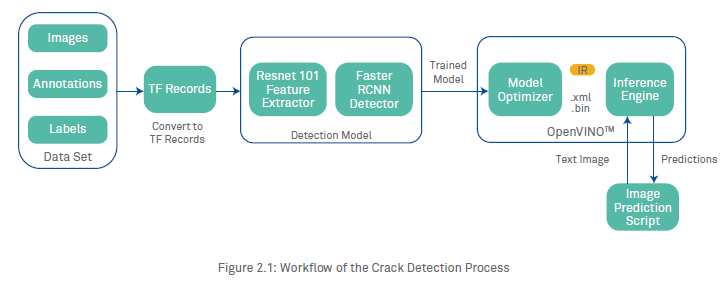
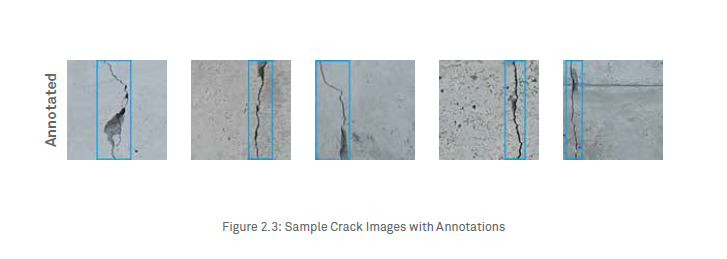
2.1 Annotations and Labelling
The images were taken from SDNET20182 dataset having 256x256 dimensions. The final dataset had a total of 1,149 images labelled as cracks.
2.2 Generating TFRecords
Faster R-CNN3 was implemented using the Intel® Optimization for TensorFlow, which reads data in its native binary format, TFRecord. Storing data in a binary file format can significantly impact the performance of data ingestion, subsequently decreasing the amount of time needed to train the model. Since binary data takes up less space on disk, this approach also makes it easier to combine multiple datasets and integrate them during ingestion. Another major advantage of the TFRecord format is that it is possible to store sequence data, such as a time series or word encodings, in a way that allows for efficient and (from a coding perspective) convenient importing.
2.3 Training the Model
We started with a pre-trained Faster R-CNN with Resnet-101 topology (originally trained on a coco dataset4), re-training all layers using images from our dataset. Training proceeded for 15,000 iterations using images from our dataset. Only parameters such as the number of classes (in our case, one), size (the width and height of the images) and the number of steps for training were modified in the original Intel Optimization for TensorFlow implementation to work on our data. The initial learning rate was set to the default 0.000300000014249 and the momentum optimizer was used to train to convergence. While training, loss, accuracy, and mean Average Precision (mAP) across the validation set were monitored to determine the status of the training and to help avoid overfitting the model.
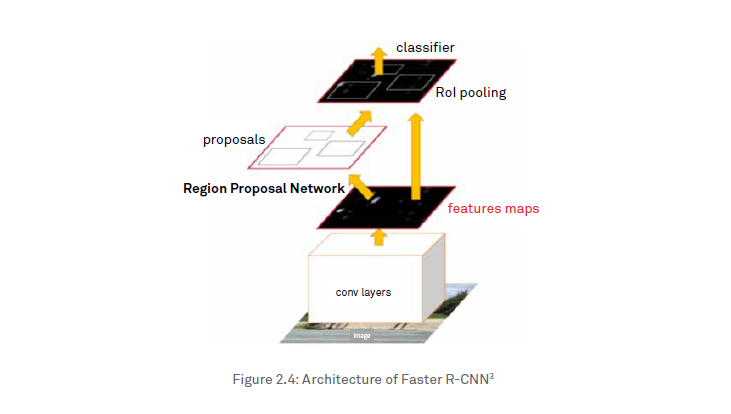
Faster R-CNN consists of two different networks—one for extracting features, and one for locating objects of interest—that work together to perform the overall task of object detection. It works by running an image through the Resnet topology to get a feature map, then deploys the activation map through the region proposal network (RPN), which outputs potential bounding boxes and their associated class labels (in the current case study, we have focused on the class – crack only). The RPN network is used to determine which potential bounding boxes contain objects. This information is given to the detection network for determining the class of the object contained in the bounding box—here, whether it is a crack or not.
After the training is completed, the trained model is converted into a frozen graph by converting the variables stored in the latest checkpoint file of the saved model into constants using the freezegraph library in tensorflow. The resulting frozen graph was used to examine inference performance on images that were not used in training.
2.4 Compute evaluation metrics of the model
Object detection models are typically evaluated according to mAP17(mean Average Precision), which is calculated by taking the mean of all average precisions. Precision is the ratio of correctly predicted positive observations to the total predicted positive observations. Recall is the ratio of correctly predicted positive observations to the total positive observations.

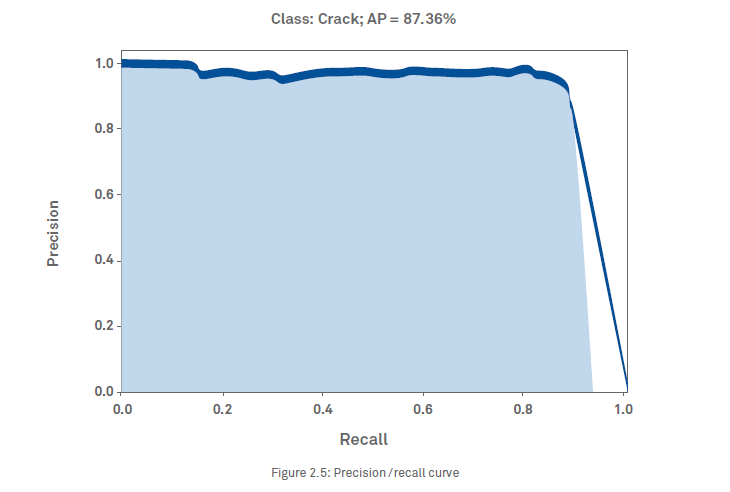
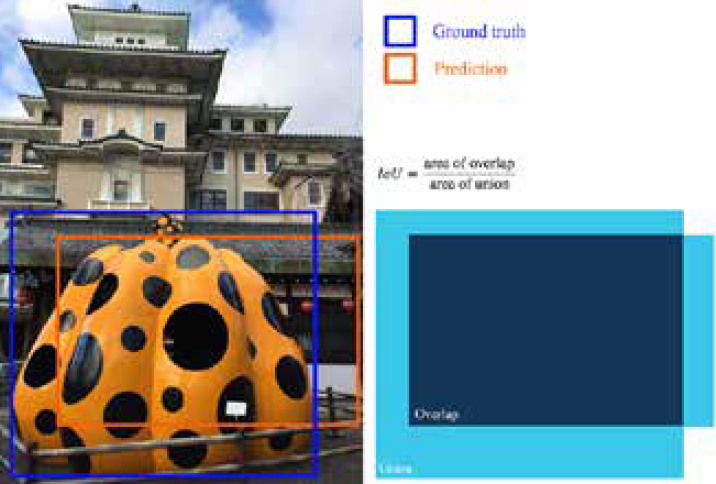
mAP is calculated by taking the mean AP over all classes and/or over all IoU thresholds [like 0.5, 0.5-0.75, 0.95]. Our model achieved a mAP score of 89.11 with the test dataset.
2.5 Inference Optimization using OpenVINOTM
To optimize model performance for inference on Intel® architectures, we used Intel’s OpenVINO™ toolkit. OpenVINO™ was selected for a variety of reasons. First, it enables CNN-based deep learning inference by compressing model sizes so
that they can adequately run on low-power devices. Second, it supports heterogeneous execution across Intel® Computer Vision SDK accelerators, using a common API for the CPU, Intel® Integrated Graphics, Intel® Movidius™ Neural Compute Stick (NCS), Intel® Neural Compute Stick 2, Intel® Vision Accelerator Design with Intel® Movidius™ VPUs and Intel® FPGAs. Third, its library of computer vision functions and pre-optimized kernels allow us to minimize time-to-market. Finally, it includes optimized calls for CV standards, including OpenCV, OpenCM™, and OpenVX.
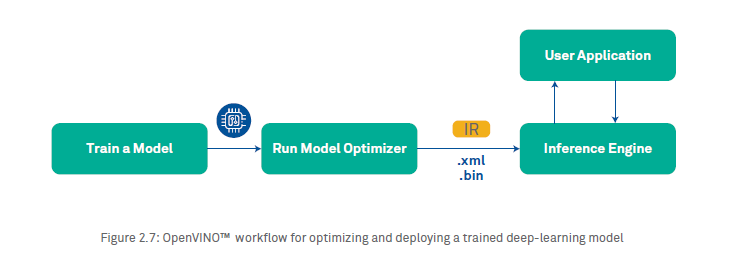
The OpenVINOTM model optimizer is a cross-platform command-line tool that facilitates the transition between the training and deployment environment by performing analysis of the model, and adjusting the model for execution on edge devices. It produces an Intermediate Representation (IR) of the network as output that can be used by the OpenVINO™ Inference Engine. The IR is a pair of files that describe the whole model—an xml file describes the revised network topology, and a bin file holds the model weights and parameters. In generating these, it removes layers that are only used in training (e.g., dropout). Moreover, if a group of layers can be represented as one mathematical operation, it recognizes this, and combines them together into a single layer. The result is an IR that has fewer layers than the original model, decreasing the inference time. After optimization, the Intermediate Representation is loaded by the inference engine.
Steps for optimizing and deploying a trained model:
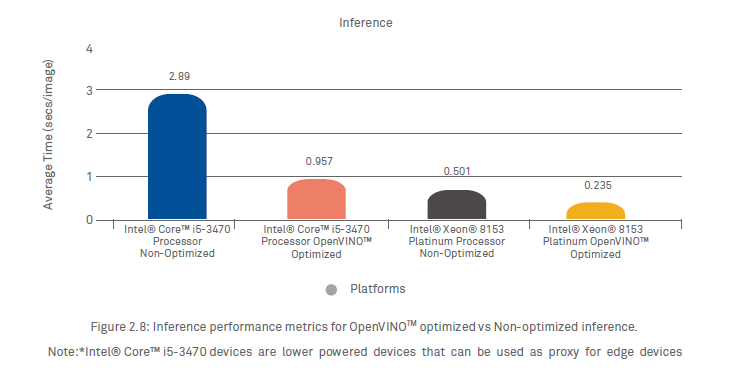
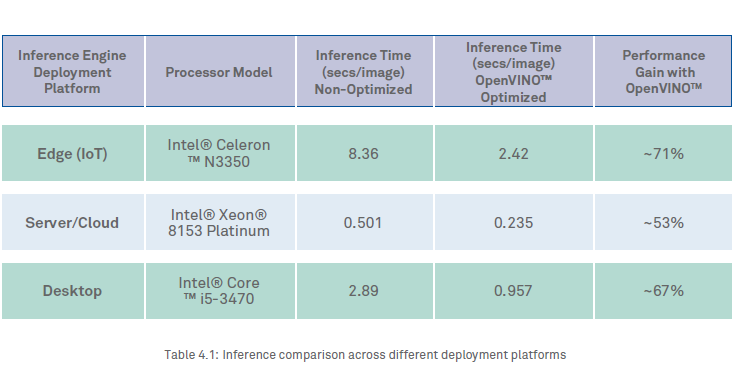
The average inference time taken for each image on a desktop-grade Intel® Core™ i5-3470 Processor and Intel® Xeon® Platinum grade Processor, with and without the Intel Distribution of OpenVINOTM toolkit optimization are shown in Figure 2.8. As shown, the Inference Engine (using the intermediate representation of the model) makes faster predictions than the non-optimized inference engine on the same machine. In our experiment, we saw a drastic reduction of ~67% in inference time using the inference engine with OpenVINO™ optimizations on an Intel® Core™ i5-3470 Processor and ~53% reduction in inference time on an Intel® Xeon® 8153 Platinum Processsor.
3. Performance comparison for Inference at the Edge
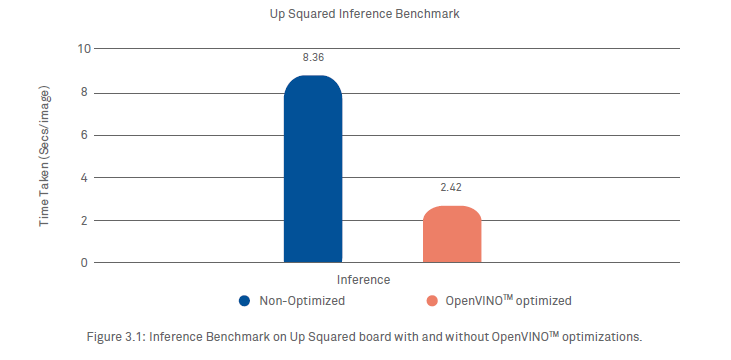
The main motivation for us to use OpenVINO™ [1] is to enable our model to be deployed onto smaller edge devices, which can be placed onto the UAVs. As a result of these optimizations, we can achieve better performance even on small devices, like an AAEON board8 with an Intel® Celeron™ N3350 processor. We observed a performance gain of almost 3x using only the processor. Up Squared is a small, portable and power-efficient board—an excellent option for an edge device that can be deployed in setups where speed can be compromised a little for the performance per watt of power. A comparison of performance on an Intel® IoT board with and without OpenVINO™ optimizations is shown in Figure 3.1.
4. Conclusion
Through this paper and the approach discussed above, we have demonstrated the use of CNN-based deep learning inferencing on edge devices with Intel® Processors, for automated structural assessment of concrete surfaces. The performance results tabulated in Table 4.1 below demonstrate a significant performance gain with OpenVINO™ enabled Inference Engine across different form factors, ranging from an IoT device to a server grade set up. The performance gain being highest, ~71%, for Inferencing at the Edge. The significant performance gain comes at negligible loss of mAP as shown in Figure 2.9 above.
Intel® Processors, along with inference optimization of OpenVINO™, combined with their availability in various form factors ranging from a small edge device to a server-grade machine, gives us the flexibility to deploy our solution in different scenarios and environments.
References
Kuljeet Singh
He has worked extensively in the IoT, mobility and embedded systems domains for 17 years. Presently a Solutions Architect (IoT & AI) with Wipro’s Industrial and Engineering Services division, he is working on the development and deployment of AI/ML based solutions for IoT domain. He is also working with the technology teams of a leading semiconductor customer on the next generation of IoT solutions. For more information, contact him at kuljeet.singh@wipro.com.
Anubhav Anand
He is a Software Engineer at Wipro who is involved in the development of applications in Predictive Analytics, Computer Vision and NLP. He is interested in building the AI-powered SaaS products. For more information, contact him at anubhav.anand1@wipro.com
Subin Guruvayurappan
He is a Software Engineer at Wipro with 3.5 years of experience in various domains like machine learning, deep learning, computer vision, DevOps and MEAN stack development. He is also interested in AI/ML and IoT. For more information, contact him at subin.guruvayurappan@wipro.com.