1. Traditional Approach and Challenges involved
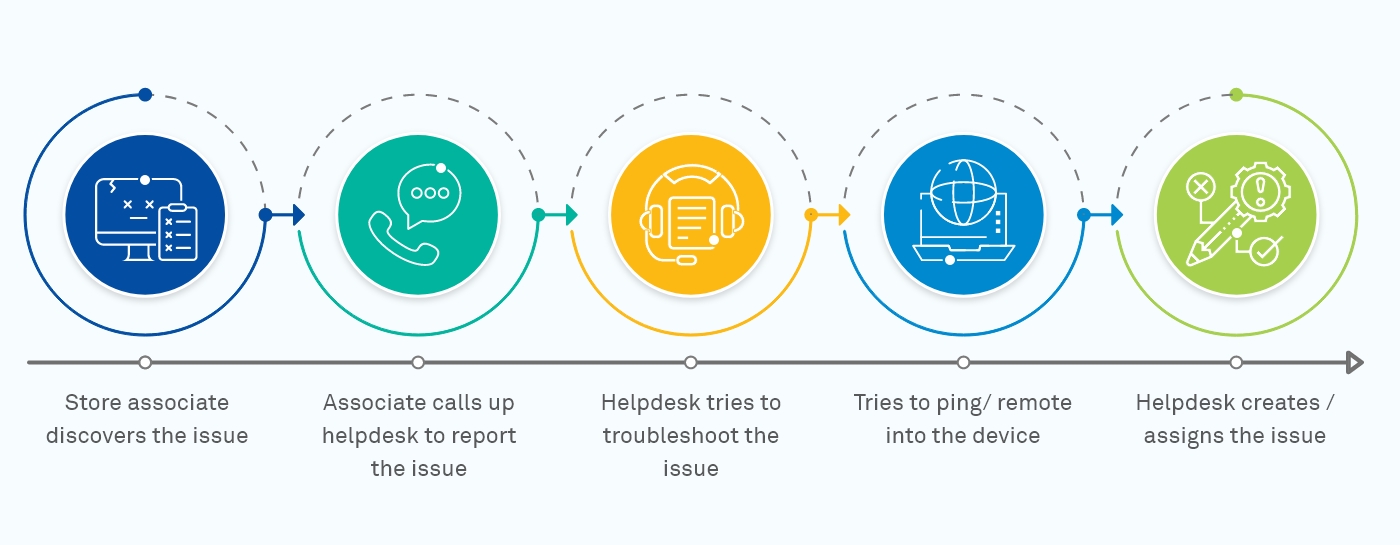
In the traditional approach, if any of the resources are faulty, an individual will call the service desk to log a ticket. The service desk representative collects the details, raises a ticket in the system, and assigns it to a support engineer. The support engineer checks ticket details and reaches (physically travels to) the place where the resource is present, identifies and corrects the problem.

This process involves various challenges such as:
2. Different Approaches to conquer the challenges
To eliminate the redundant manual controls and reduce human error, which costs a significant amount of money, a system should exist to frequently monitor and ensure that the resources are present where they need to be, and are functioning efficiently and effectively. Such a control system can be built using two different approaches:
2.1 Agentless monitoring system.
Agentless monitoring works typically using what is already exposed by the vendor, without installing any extra piece of software in the client’s environment. For example SNMP (Simple Network Management Protocol) is used to monitor servers and network devices in an agentless manner and WMI (Windows Management Instrument) is used for monitoring many windows based servers and applications.
Agentless monitoring via WMI (Windows only servers) or VMware (VMware only services and instances) can allow for some level of customized scripting but agentless solutions do not provide the same level of expansion and integration that is possible with an agent-based solution.
Pros and Cons of Agentless monitoring
Pros |
Cons |
|---|---|
|
|
2.2 Agent-based monitoring system
Agent-based monitoring typically needs a small software component to be installed on the resource which is to be monitored. The agent installed collects the data and responds to the monitoring application. Using agent-based monitoring, granular metrics can be accessed for better monitoring, alerting, and reporting. For example, zabbix agent in the case of the Zabbix tool and various node exporters in the case of the Prometheus tool are used to collect metrics at the granular level and are customizable.
Agent installed eases the direct interaction with the client platform and services through which execution of the automated corrective actions can be done in case of proactive/reactive maintenance.
Pros and Cons of Agentless monitoring
Pros |
Cons |
|---|---|
|
|
However, the decision on using agentless or agent-based monitoring depends on the actual need. In simple scenarios, where more granular metrics are not needed and there are large nodes to be deployed, agentless solution is suitable. But for large-scale, real-world production environments, agent-based monitoring is the way to get detailed, valuable visibility and analytics-based insights in an efficient fashion.
3. Various outlooks to identify the Resources
Based on the organization's size (large/medium/small), resources that are to be monitored might be in the thousands, and uploading details of these resources to the database manually is a tedious job and might cause errors. Here comes the need to automatically detect the resources to be monitored.
Identifying the resources that are to be monitored can be a one-time manual activity by uploading a data sheet to the database. There are tools/apps available to auto-discover the resources within a network based on the IP range/ subnet in case of agentless monitoring. With agent-based monitoring, the discovery of the applications, databases, microservices, etc. is also possible.
4. Different Metrics and KPIs that can be monitored
Different metrics collected from the resources combined with the thresholds configured can be grouped, organized to provide meaningful insights (KPI) of the organization's resources.
Some of the metrics that can be monitored:
4.1 Agentless:
4.2 Agent based:
Based on these metrics, different KPIs like resources that failed more times, the percentage of critical alerts, etc. can be visualized.
5. Seeing is believing (Graphical representation of the KPIs)
Several tools like Grafana and Prometheus are available that provide configurable dashboards/Reports, really easy on the eye, and can be integrated with monitoring applications as well as different types of time-series databases. Some of the tools also provide a specific query language to visualize the required KPI/metrics.
6. Know it even before it is failing (Alerting and data-based predictive analysis)
By configuring the meaningful thresholds, alerts can be triggered and the monitoring application can be integrated with the different notifications systems like slack, SMS notification, SMTP server for email alerts, etc.
Different types of forecasts can be done based on the time-series data stored by the monitoring applications. Using different techniques like cluster analysis, text analysis, and using different ML algorithms on the time series data, users can configure alerts based on remaining useful life (RUL), anomaly detection, failure detection, etc.
7. Industry trends in monitoring solutions
Since the growth of organizations is rapid, resource utilization is increasing. In this regard, monitoring solutions help organizations with easy detection of the availability of resources, downtimes, and empowers them to proactively detect future problems.
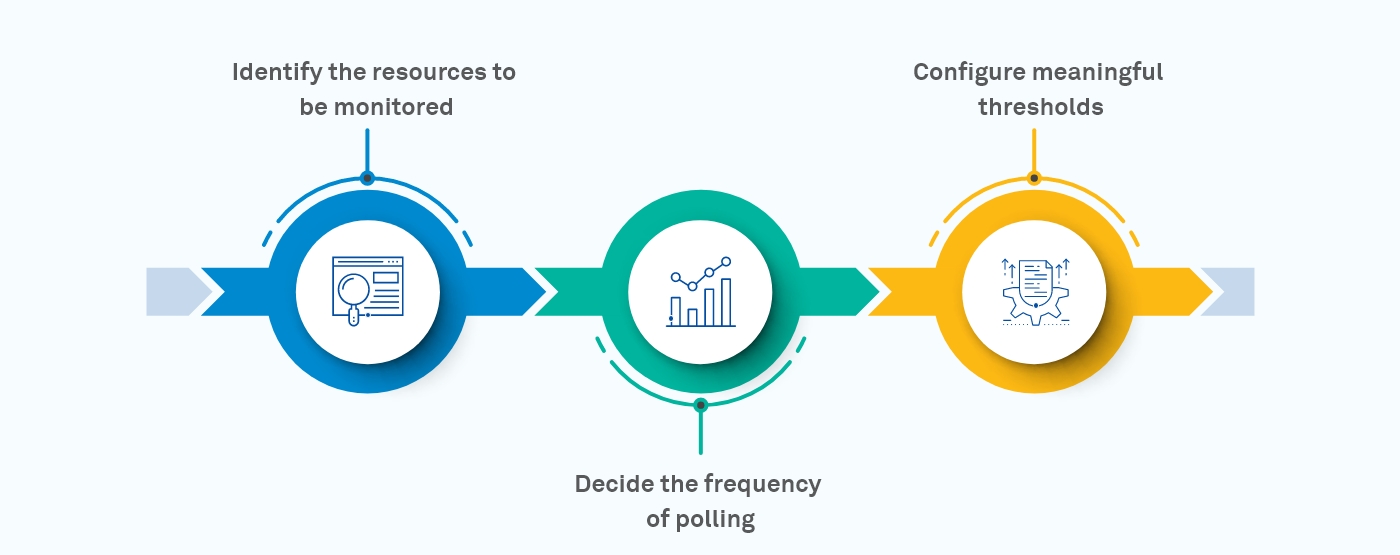
Below diagram shows the typical factors of resource monitoring:

There are multiple monitoring solutions available, which provide end-to-end execution and support in the market. They can either be hosted on public/private clouds or on premise.
8. Wipro’s Optima Remote Monitoring Services Solution
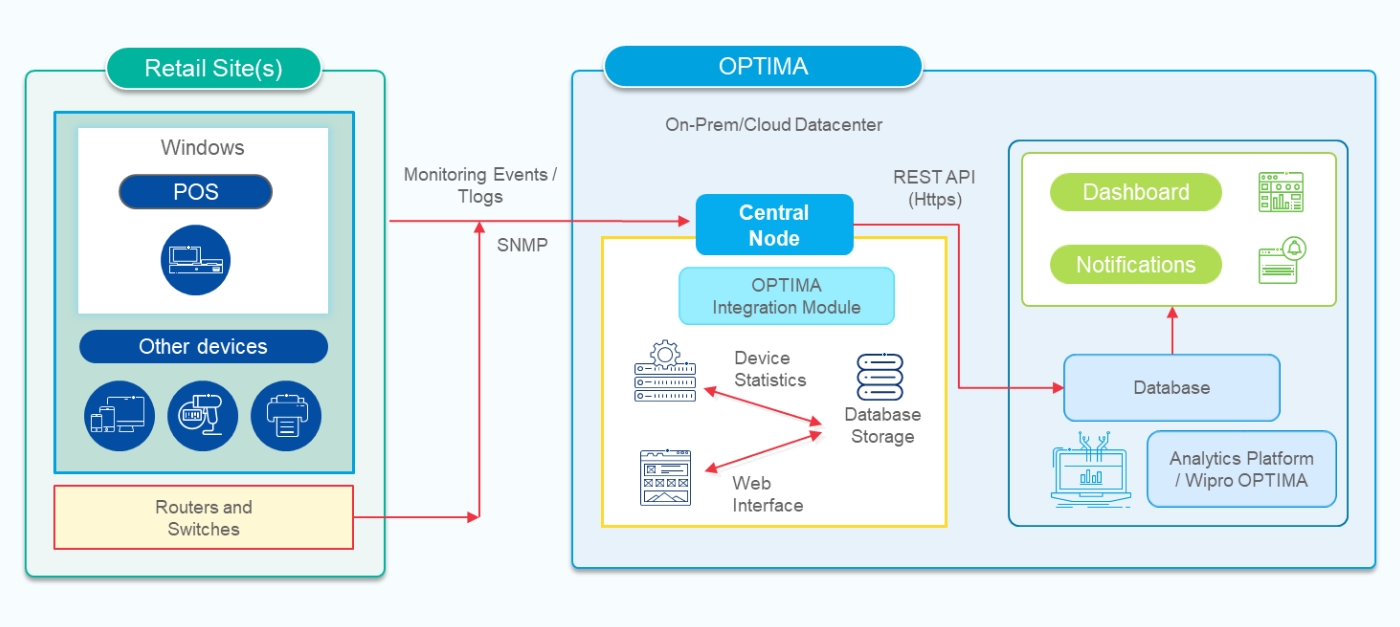
Optima RMS is an extensible and configurable monitoring solution, comprising multiple components for the ever-evolving enterprise ecosystem.
Optima RMS collects, normalizes, and monitors real-time data across enterprise resources and provides deep insights into the resource's health and performance through powerful visualization, analytics, and dashboards. It also provides downstream integration with a ticketing system like Service Desk and integrates with reporting tools like Grafana.
8.1 Monitoring Process flow - Optima


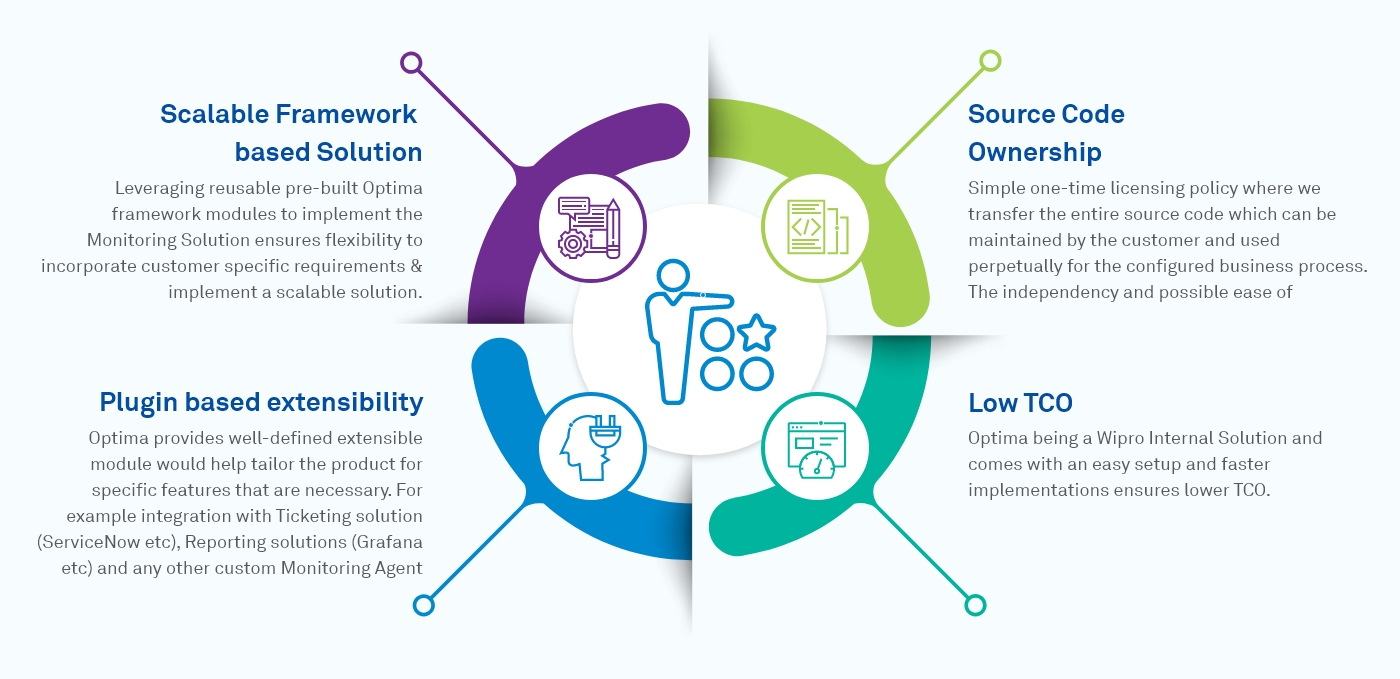
8.3 Benefits of the Optima RMS
8.4 Differentiators

9. Summary
Monitoring applications helps organizations identify possible issues before they affect business continuity. It also helps to detect the root cause of problems when something goes wrong. Be it a small business with less than 50 nodes or a large enterprise with more than 1,000 nodes, continuous monitoring helps to develop and maintain high performance of resources with little/no downtime.
The decision of which monitoring tool to choose depends on many factors like the size of the organization, expansion plans, budget constraints, etc. However, organizations should look for a comprehensive monitoring application that meets present-day needs while also providing scalability for future expansion.
Sarada Kallakuri
Technical Lead - Software Engineering Practice, IES, Wipro Limited.
As an AWS Certified Solution Architect - Associate, and a Sun Certified Java Professional, Sarada has around 14 years of experience in software development with expertise in various technologies and tools like Java/J2EE, Python, Ansible, Hadoop Administration, vRA, vRO.
Radhakrishna Singuru
DMTS - Senior Member – Software Engineering Practice, Industrial & Engineering Services, Wipro Limited.
Radha has more than 24 years of experience in product and system software development spanning cloud and virtualization technologies, scalable platforms, SDN, L2/L3 switching and stacking software, etc., across multiple industry domains.